 Typica: Software for Coffee Roasting Operations
Profile Printing in Typica
Recently I've gotten some questions about printing roasting data in Typica and I suspect that the reason for this is just that the interface to that feature isn't very good.
When I first started work on Typica, the ability to print roasting plans was very important. First, I wasn't sure if this idea of using a computer to collect measurement data and present that in a useful way was going to prove worthwhile (it has) so if I needed to roll back to manual logging and paper records, I wanted an easy way to get back to that. The way Typica prints roasting data is very similar to the sheets that I was putting together before I wrote Typica with measurement data on the left, a graph in the upper right, and the ability to include sensory notes, expected weight loss, and a table showing how much green coffee I needed to ensure that I'd have commonly needed amounts of roasted coffee on my production roaster.
The other important early reason was that I do a fair amount of work related travel and if there were some problem with Typica that happened while I was out I wanted the rest of the roasting staff to have a set of paper roasting plans that they could fall back on if they needed to. Now that Typica has been in use here for over a decade I don't think catastrophic software failure is a serious concern, but when the software was less proven this is something that I wanted.
Now my main use of printing is if another roaster is curious about how I'm roasting something. I can quickly print off a sheet and share that information even if they're not using Typica or if sharing that data electronically is not practical.
Printing can be done from either the main logging view or by pulling up batch details from the roasting log and clicking the "View profile" button. In either case you can then go to the File menu and select Print or use the usual keyboard shortcut.
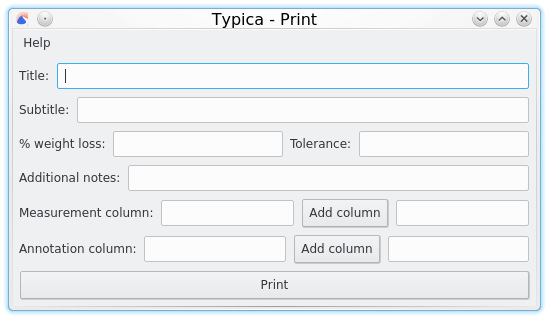
Here's where it gets strange. Instead of the usual print dialog, you get this other window where you can customize what gets printed and add additional context to the print out. Most of these are optional and you can choose to use those fields, in which case extra things will be added to the printout, or you can leave them blank. The only things that are required are at least one measurement column and at least one annotation column, and these are a bit strange because you enter a column number and then hit the Add column button to move that number over to a list on the right. Column 0 is always the Time column and does not need to be specified, the first measurement column is 1, and the annotation column follows all of the measurement columns for a given batch. If you're in the main logging view and have data from two batches showing in the table, there's a second set of measurement and annotation columns. It's important to count correctly. Like I said, not a great design.
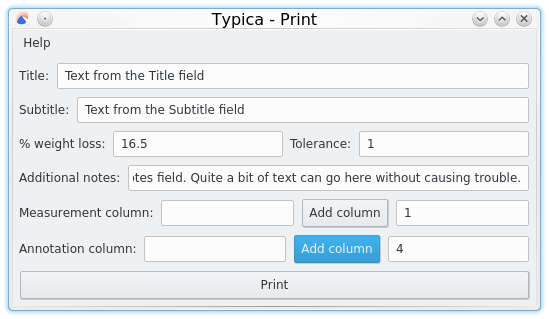
Here's an example that's filled out. When you click the Print button, the usual Print dialog for your operating system will show up where you can select all of the usual printing options. In this case, you can see that I've chosen a single measurement column (1) and a single annotation column (4). This is from a batch that was roasted on my production roaster, so column 1 contains measurements from my bean temperature probe, column 2 contains measurements from my air temperature probe, and column 3 contains a rate of change calculation on the bean temperature probe measurements. If I'm using the paper to replicate a batch instead of using Typica, I'm not going to have indicators showing air temperature or rate of change, so I don't need those and have chosen to omit them from the print. By not showing information that I can't use in this scenario I'm making it easier to use the print.
The result is something like this.
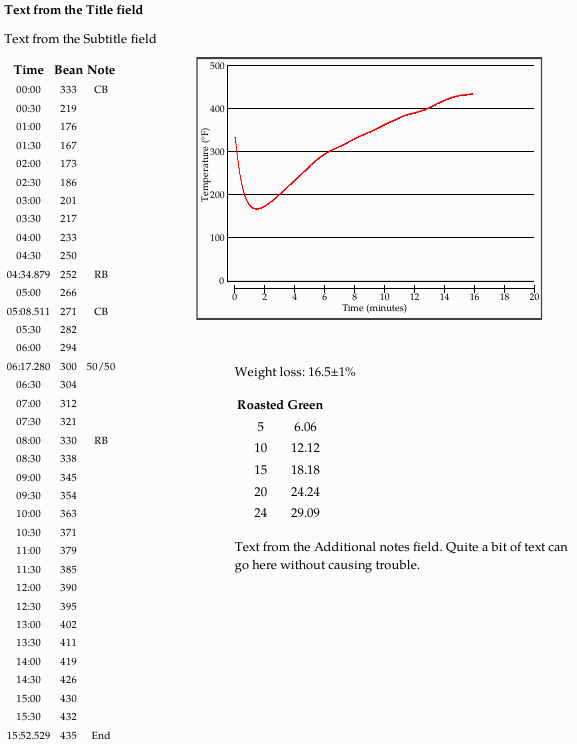
Here you can see how the information from the various fields are presented. The title field is bold and up top. I generally use that to indicate the name of the roasted coffee item.
The subtitle field is below that and in cases where it might not be obvious which green coffee(s) to use, I'll put that information there.
The left side is filled with a table showing time and information from the specified columns. This shows one measurement per 30 seconds plus the data from any time that has a note associated with it. Here the notes all refer to airflow changes on a Diedrich IR-12. It would be nice to have more flexibility here. It might make sense to change this to print according to whatever the table view is currently displaying. This defaults to one measurement per 30 seconds which in my experience works well for manual logging, but that can be dropped back to 1 measurement per minute or several settings that present more frequent measurements. The problem with more frequent measurements is that the information will usually no longer fit on a single page. It's very important to make sure that the correct column number is used for the annotation column. If you accidentally specify a measurement column, this is likely to have multiple values per second and since every row with an annotation gets printed, you can easily end up getting massive and essentially useless prints that way.
On the right is a graph of the same information as is presented in the table on the left. There's considerable room for improvement here.
If expected weight loss data is entered, then this information will be displayed below the graph along with a table showing the amount of green coffee needed to produce various commonly needed amounts of roasted coffee. That's tied to the capacity of my production roaster and it would be nice to make that configurable so that people with different sized roasters can get information that's more relevant for them. Note that this is calculated with the largest weight loss value, so here it's showing a 16.5 plus or minus 1 percent expected weight loss, which means that values in the table are based on a 17.5 percent weight loss. If the expected weight loss is realistic and the coffee was roasted correctly you should always get at least the amount of roasted coffee displayed in the table for a given amount of green coffee, but you might get a little more. With a maximum capacity of 30 pounds green coffee in my production roaster I can see that while I might be able to get 25 pounds of roasted coffee, the upper end of the weight loss specification only guarantees that I'll be able to get at least 24 and a fraction pounds from a full capacity batch.
Below that there's a good amount of space for additional text. I mainly use this when there's something unusual about how the coffee handles in the roaster but this is also a good place to put things like sensory notes or roast color specifications.
Another question related to this was getting a PDF instead of a sheet of paper. I think this is something that it makes more sense to have the printing service handle. It's a stock feature of Windows 10, Mac OS X, and most desktop oriented Linux distributions, though people with older versions of Windows may need to use third party software to add printing to PDF. The advantage of handling it that way is that you get PDF printing in every program.