 Typica: Software for Coffee Roasting Operations
Two New Derived Series
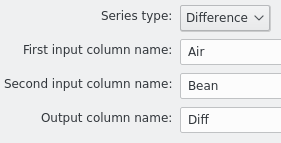
In April I was one of the judges for the U.S. Roaster Championship competition in Seattle, WA. During his presentation, one of the competitors mentioned that he was paying attention to the difference between his air temperature and his bean temperature and he wanted that to look a certain way while progressing through the roast. While it's certainly possible to eye ball a trend there, and I got the impression that this was exactly what he was doing, it seemed like it might be easier to consider that during a roast if Typica could just calculate that difference and plot it as a relative measurement series. Today, I added that feature.
Another possible use for this is comparing hot air entering a drum against exhaust air temperature. I'm not sure how useful either of those derived series might be, but at least it's unlikely to be harmful and it's a very small addition. I'm sure there are people with questions that a feature like this makes easier to answer and if it's useless outside of that context it's not difficult to turn the feature off once it's no longer needed.
While writing that, I also decided to provide a way to take the mean between the latest measurements on two series. The only difference between that and a difference series is the calculation performed so this was also trivial to implement. Again, this is something that I expect most people won't be interested in using, but if you had multiple thermocouples supposedly measuring the same thing, an average between those might be more reliable than either. For example, if you had both a thick and a thin thermocouple measuring seed temperature, these are going to have different measurement characteristics and are subject to different types of measurement error. Averaging measurements between the two might work better than using either by itself (it also might not so you'll want to test that theory if you decide to try this and make sure it really works on your machine before relying on this).
Both of these can be combined with themselves, each other, or with other ways of manipulating measurement data such as performing calibration adjustments or calculating rates of change. They can also use input data that's arriving with different sample rates, in which case the result will be rate limited to the slower data series.
Less significantly, I also switched the logo icon to the one you've been seeing on this web site. I had intended to save that for the Typica 2.0 release, but that was before I knew that it would make sense for a 1.8 release to exist. The shape and color of the new logo are based on a particular coffee plant that I saw on my most recent trip to Mexico.
There are still a few things that I'd like to finish up before releasing Typica 1.8. I might have to push the release date back to early August, but I intend to get this out as soon as I can.