 Typica: Software for Coffee Roasting Operations
Roast Planning With Cubic Splines
My favorite curve (doesn't everybody have one?) is the relaxed cubic spline, that piecewise polynomial with continuous first and second derivatives. The properties of this type of curve provide a simple and accurate model in a surprisingly large range of applications, but it's also often overlooked in favor of other curves that are more difficult to properly parameterize for no reason other than the presence of these other curves in common GUI toolkits. If you look at the properties of cubic splines, they have a lot in common with what a graph of seed temperature over time looks like in coffee roasting.
When roasting coffee, it's a good idea to have a plan. Know what you intend to do at the roaster, match your roast against that plan, then evaluate the results and adjust the plan for the next batch if that evaluation suggests that a different plan is needed for that coffee. When performing roasting exercises that involve comparing changes in specific parts of a roasting plan, it's especially important to have plans for all of these batches and to match these precisely. Improvising too often results in both the intended roasting difference and several unintended differences, making it more difficult to properly attribute changes in the cup to the correct part of the roasting plan.
Previously I've tried using linear splines for these roasting plans. It's better than nothing and easy to generate, but this sort of plan has sharp corners at the control points that are impossible to reproduce on a coffee roaster. To follow the plan, you need to anticipate the changes and you'll be off a bit at the start and end of each range to anticipate what needs to happen next in order to come close to the intent.
Recently I've been trying to use cubic splines instead and early indications are that the roasting plans generated can be much easier to follow.
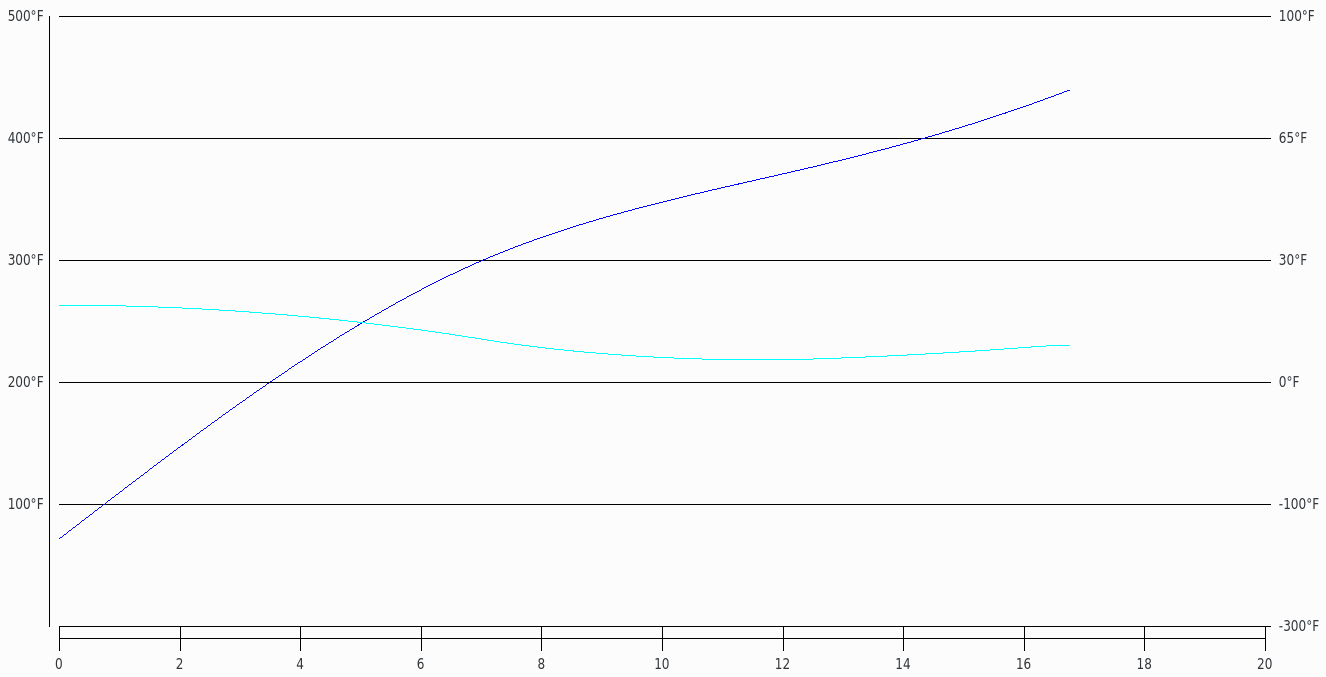
Here is an example of a roasting plan generated with this technique. The first thing that you might notice is that I haven't modeled turn around. This was an intentional choice. The initial decline often seen in roasting data is an artifact of how the temperature measurement is performed. To get a good model of turn around, the curve would require additional control points that don't really correspond to anything meaningful, and these would need to be different for different batch sizes and for different temperature probes. Ignoring it produces a plan that's both more generally useful and easier to generate.
The other thing that you might notice is that the same data can be used to generate a rate of change series and this can also be closely matched at a roaster. In this case I'm just comparing for each second the value that would have been measured a tenth of a second earlier and scaling that out to a rate per 30 seconds. This keeps that data series as a secant line close enough to what data logging software can produce. When modeling turn around, it would be necessary to closely match the calculation window to the window used in your data logging software, otherwise you get an unmatchable spike in the rate immediately after turnaround followed by a slow rate decline. Making this a parameter rather than just calculating the 2nd derivative at each point allows the flexibility to do either. Ignoring turnaround makes it easier to match up to the plan faster than a plan generated by this method with turnaround modeling.
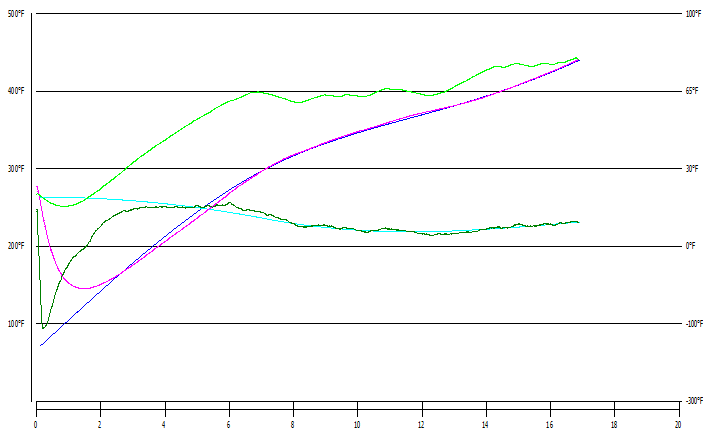
Here you can see my attempt at matching that roasting plan. Profile translation was turned on at the green to yellow transition (300 degrees on this roaster) and I was 8 seconds off there, but previous testing shows that this doesn't impact the cup. The log shows that I stopped the roast about half a second before the planned end time after that translation adjustment, but measurement hardware is only recording 2 measurements per second so that's about as close as I can expect to get. Looking at the range from 300 to the end, everything matches very closely, and this is a much better match than is possible with a linear spline.
The plan was generated from only a few points: a starting temperature set at a typical room temperature, expected time and temperature for the start of the green to yellow transition, the same for yellow to brown transition, start of first crack, start of second crack, and the desired end point. If I weren't roasting past the end of second crack I could save a point. For this early proof of concept I've just hard coded those values, so generating different plans requires editing the values in source code, recompiling, and directing output (in the form of XML that Typica can open) to a file, but early results are good enough that I think it would be a good idea to put some more work in on this and make a small program that other people can use to generate this sort of roasting plan. Perhaps it will also become a feature built into Typica at some point, but I'd like that to be a stand alone utility first as it should be useful for anybody who roasts coffee, not just people who use Typica.